Gestamp Facility Airflow Analysis
Back to Main PageProject Overview
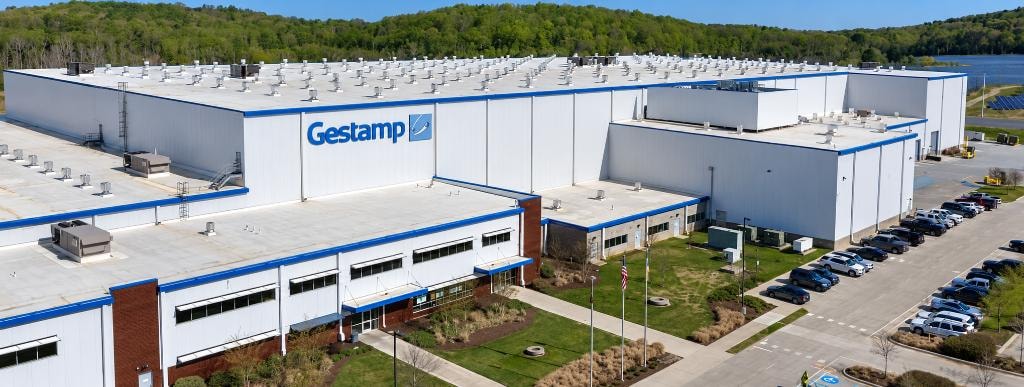
To demystify complex environmental data, we deployed hundreds of sensors across this 200,000+ sq. ft. Chattanooga manufacturing facility. The resulting data was translated into dynamic color maps, providing clear, actionable visualizations of temperature and humidity fluctuations over time.
Temperature & Humidity Visualization
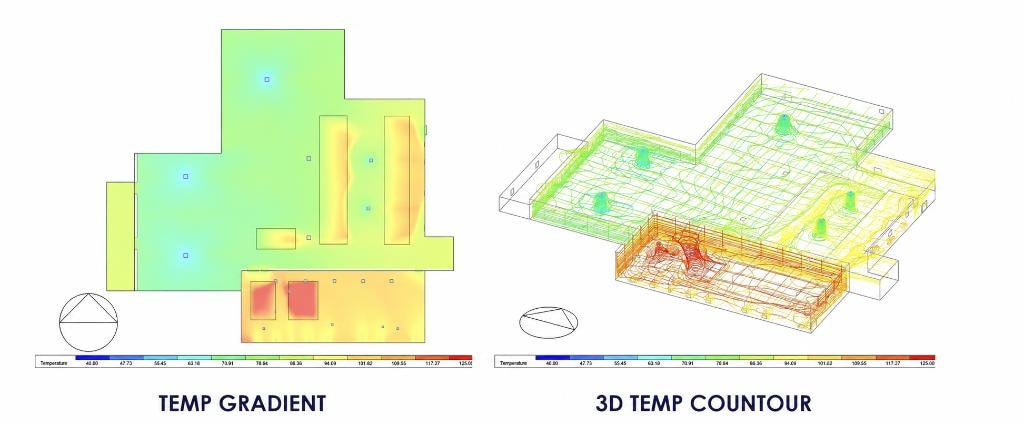
These dynamic visualizations translate data from hundreds of facility-wide sensors into time-lapsed color maps. Each frame captures a precise snapshot in time, tracking temperature and humidity shifts across the 200,000+ sq. ft. space to identify critical hot zones and guide targeted engineering recommendations.
CFD
Using Computational Fluid Dynamics (CFD), we analyzed the complex airflow and thermal dynamics within the 200,000+ sq. ft. Gestamp facility. This advanced modeling bridges the gap between raw environmental data and actionable engineering recommendations by simulating precisely how air moves and transfers heat across the manufacturing floor.